


Expedition Arctic Ocean 2026, blog post 15: Inside the Research School
Five weeks into the expedition, the routines of life aboard Oden are well established, but there is still something new to learn every day. In these three diary entries, Linnea shares lessons from working alongside other research teams, insights into scientific collaboration, and a closer look at the instruments helping us observe the Arctic atmosphere in one of the world's most challenging environments.
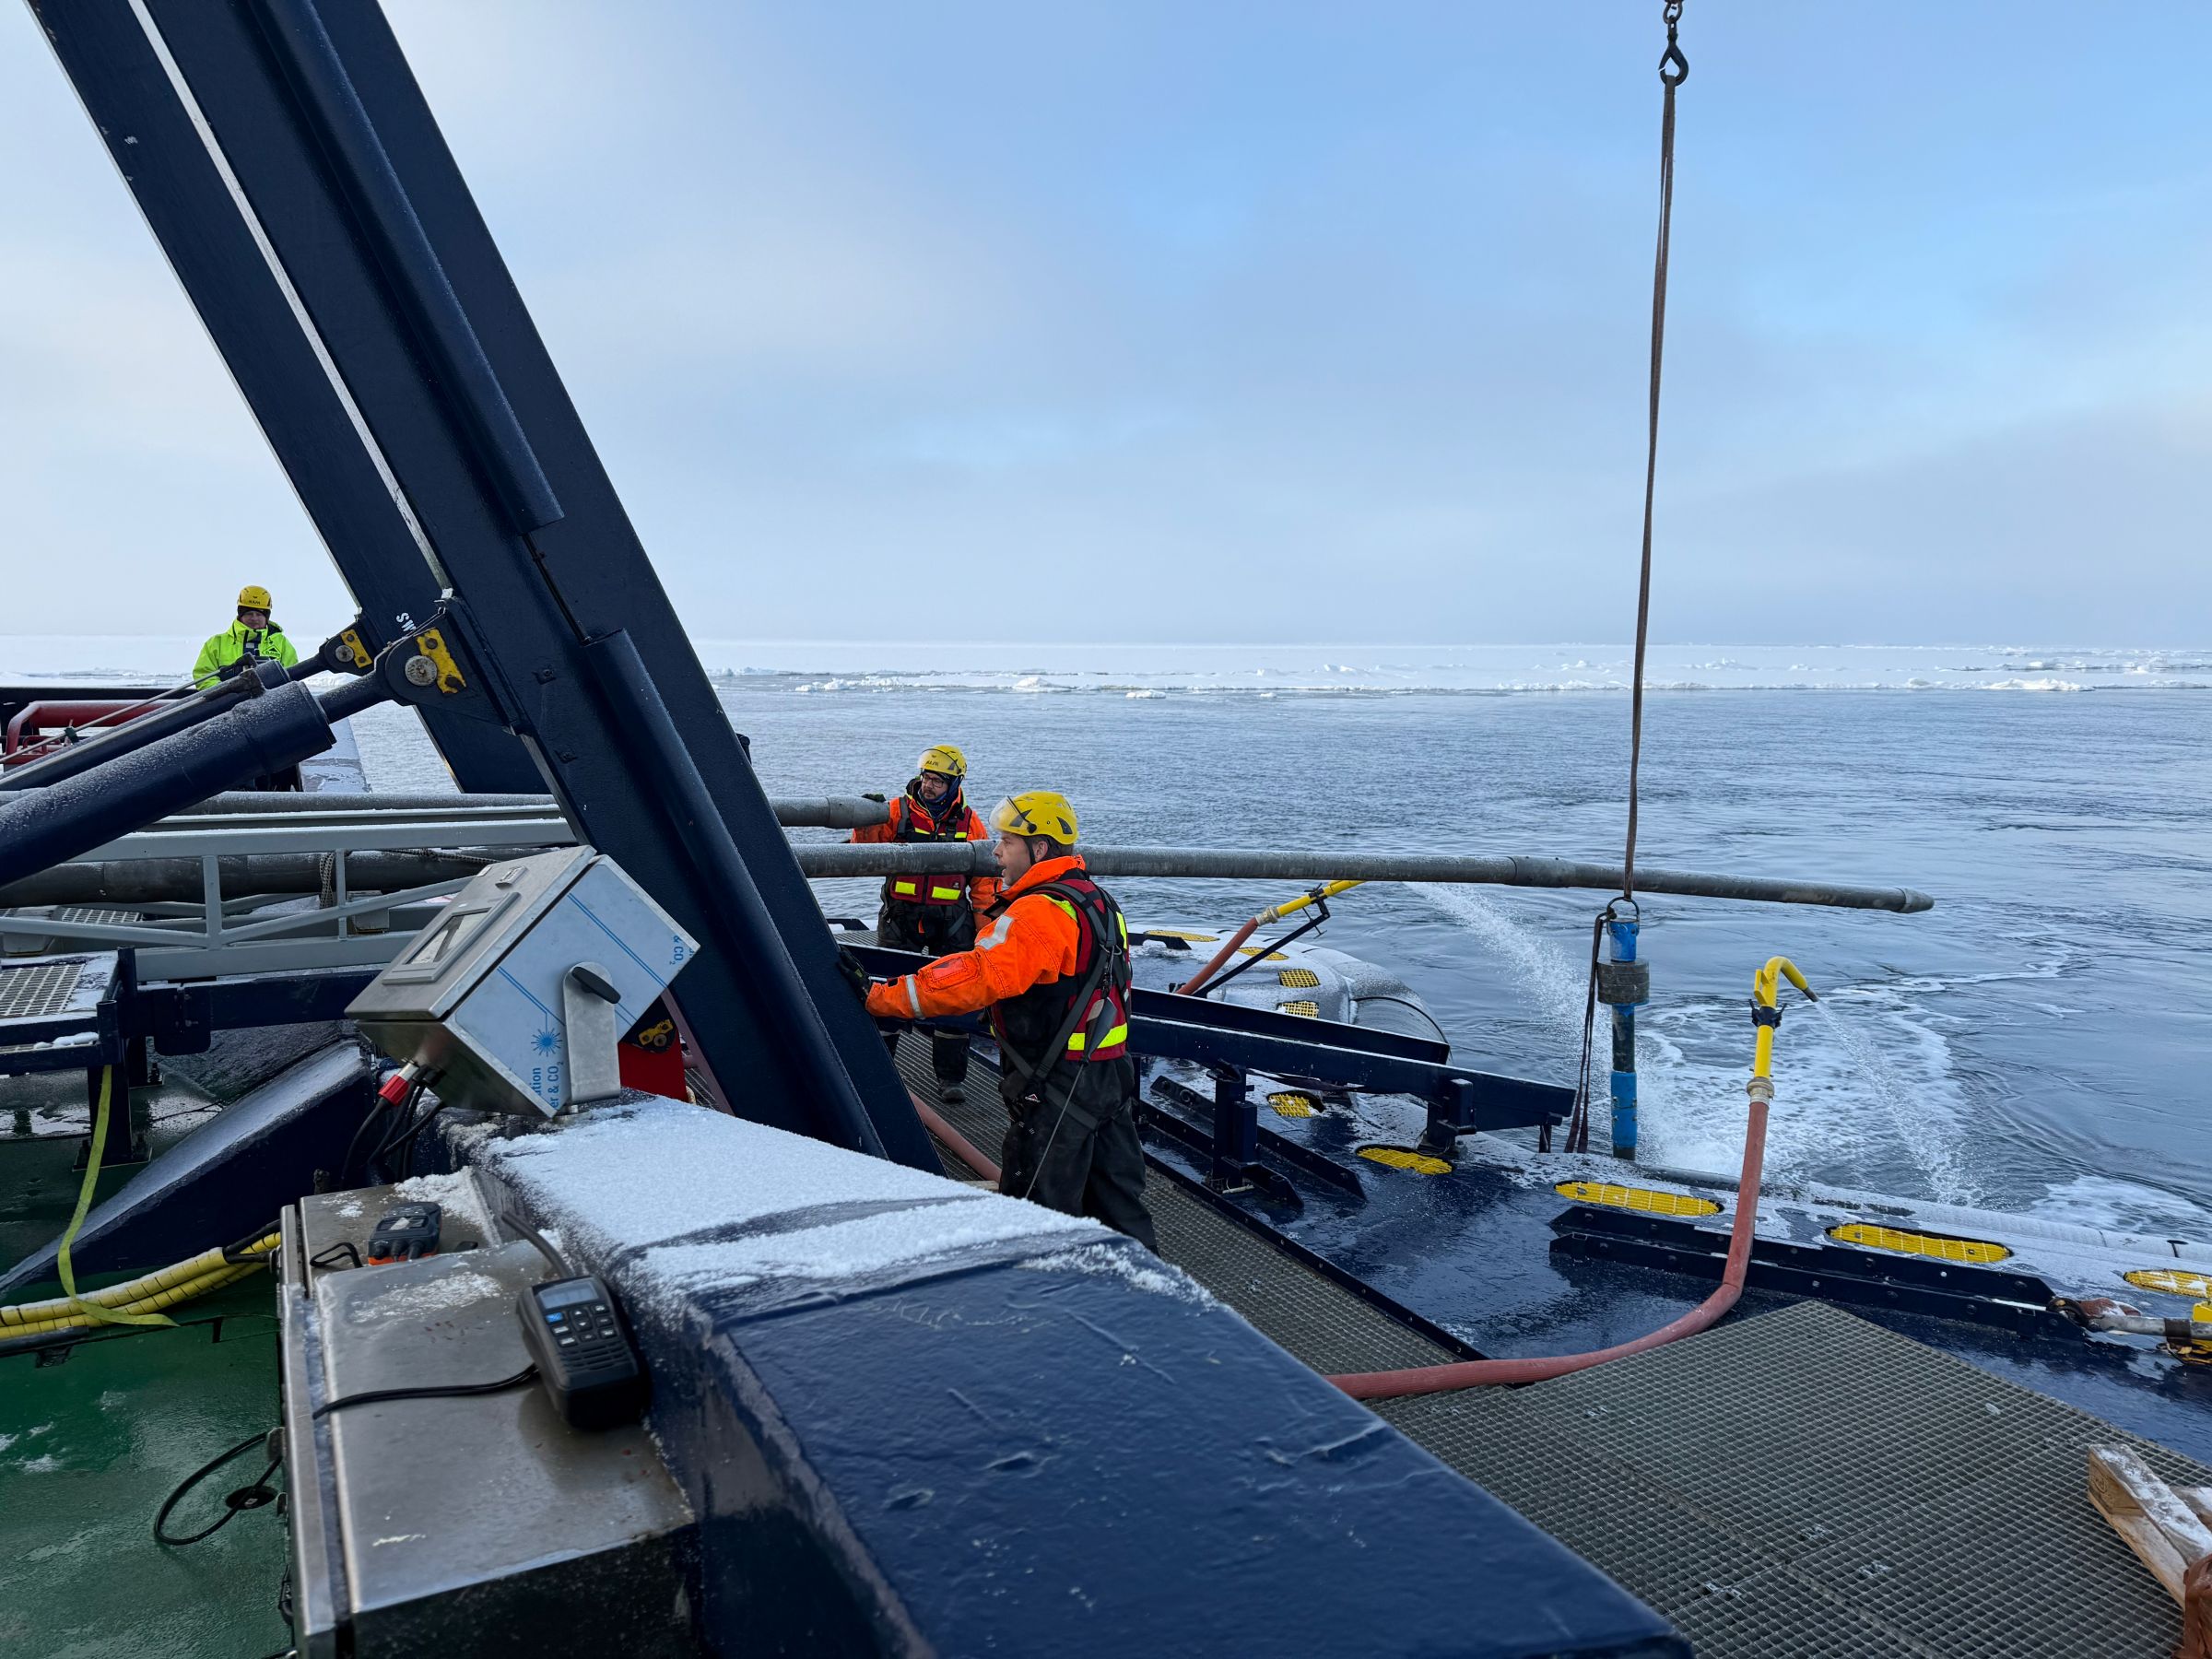
Caption: Richard Gyllencreutz and Matt O’Regan guiding the 12 m long piston corer (used for collecting sediment cores from the seafloor) into the sea.
Internships
The expedition is organized as a research school. The purpose of the school is that we should learn to do observations in our field, but also to give us an insight into other fields of Arctic research. So while I have learned a lot about operating all the meteorological instruments onboard, I have also learned many other things.
The research school contains six different work packages: Marine geology; Primary production; Sea ice properties; Physical oceanography; Ocean floor mapping; and Meteorology and Aerosols. There has been a lecture program where each work package leader has given three lectures covering the basics of Arctic research within their field. I have found the lectures very interesting, and it has been nice to get an insight into the frameworks within which the different groups work.
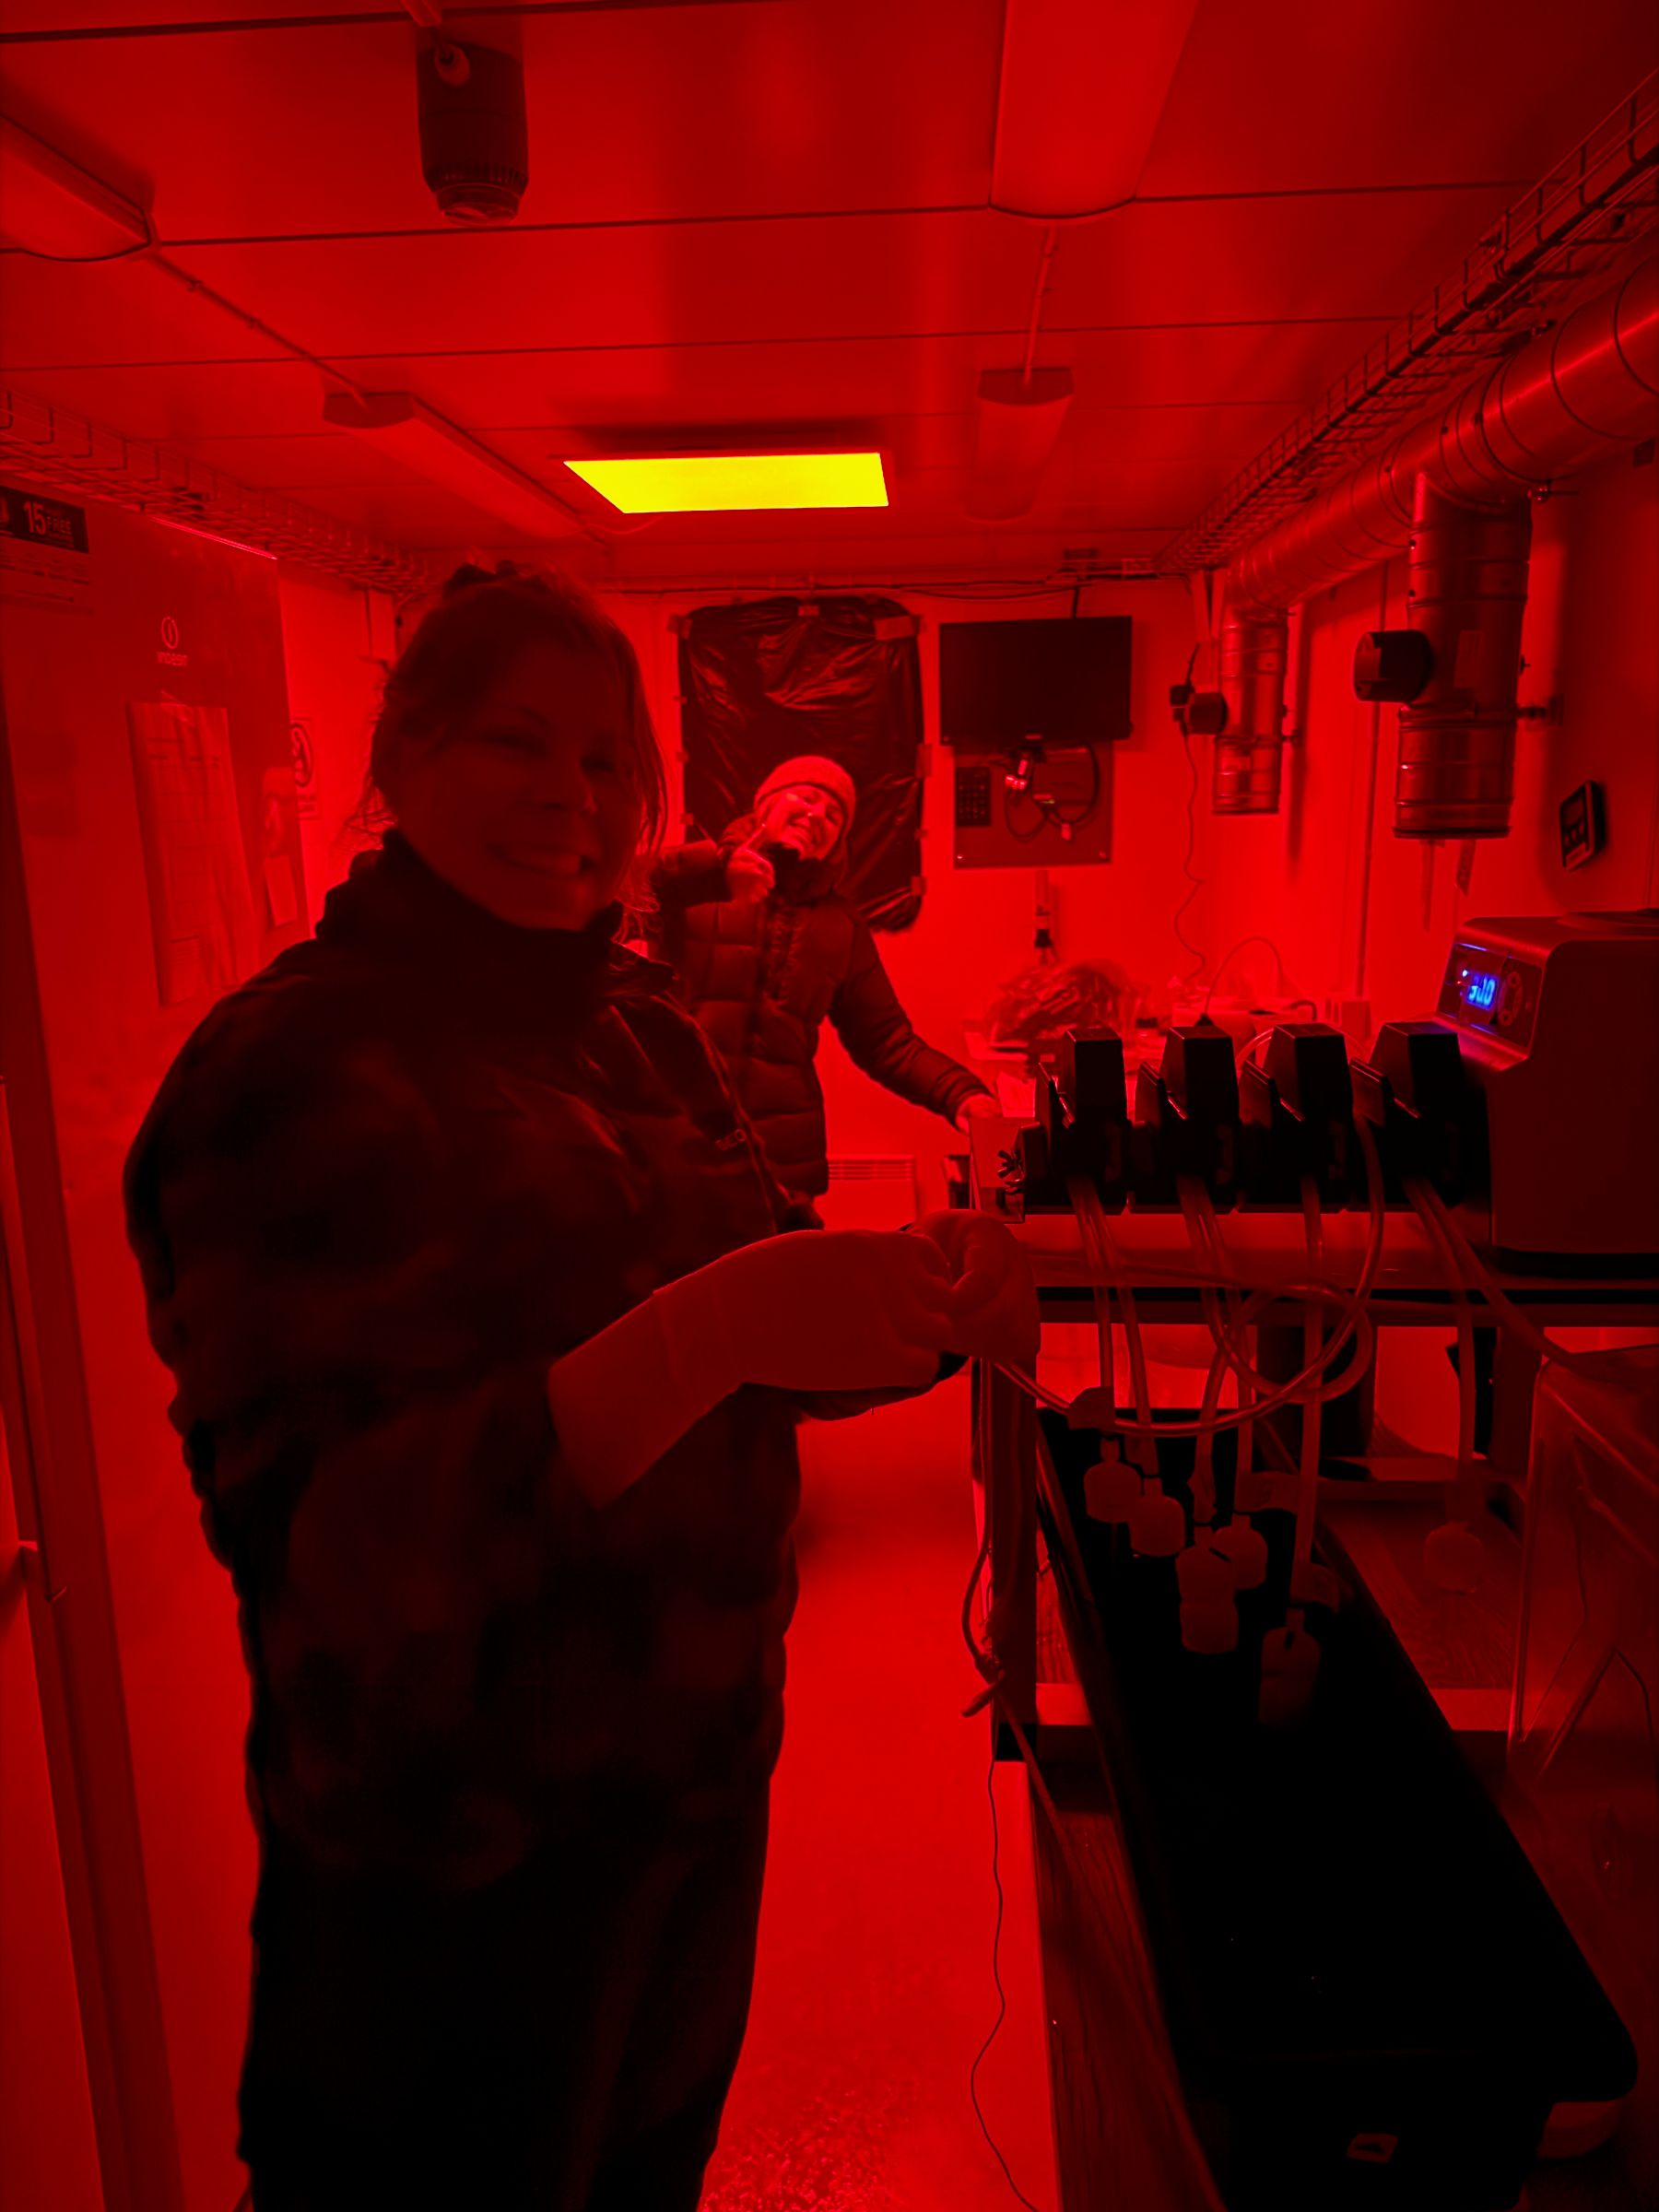
Caption: Katerina Wagner (Linnaeus University) and Miriam Marcelle De Vries (Stockholm University and UNIS) in the red light biology lab.
The most fun part of the research school, however, is that we have gotten to do internships with other work packages. So I have spent a long and cold but beautiful afternoon on the aft deck helping the geology team retrieve a sediment core from the bottom of the ocean. The sea ice team has taught me how to do an “ice watch” on the bridge, documenting the current state of the ice in a standardized format. Yesterday, I spent the morning in the biology lab, helping the primary productivity team filter their daily samples, and learning that they work under red light to avoid disturbing their analysis of photosynthesizing organisms.
Even though we are all studying the same environment our methods differ greatly. Some of the teams spend a lot of time in the lab, filtering water to gather material to analyze or preparing sediment samples for analysis. Some teams are very dependent on getting out on the ice to collect samples or measure properties of the ice and the sea water. Our team stands out a bit in that our observations do not require much intervention; our instruments sit on the ship and collect data all the time and our job onboard is mostly to monitor the data and be ready to fix any problems that might appear. The internships have given me a great appreciation of all the work that goes into the data collection for our colleagues!
/Linnea Huusko (2026-09-15)
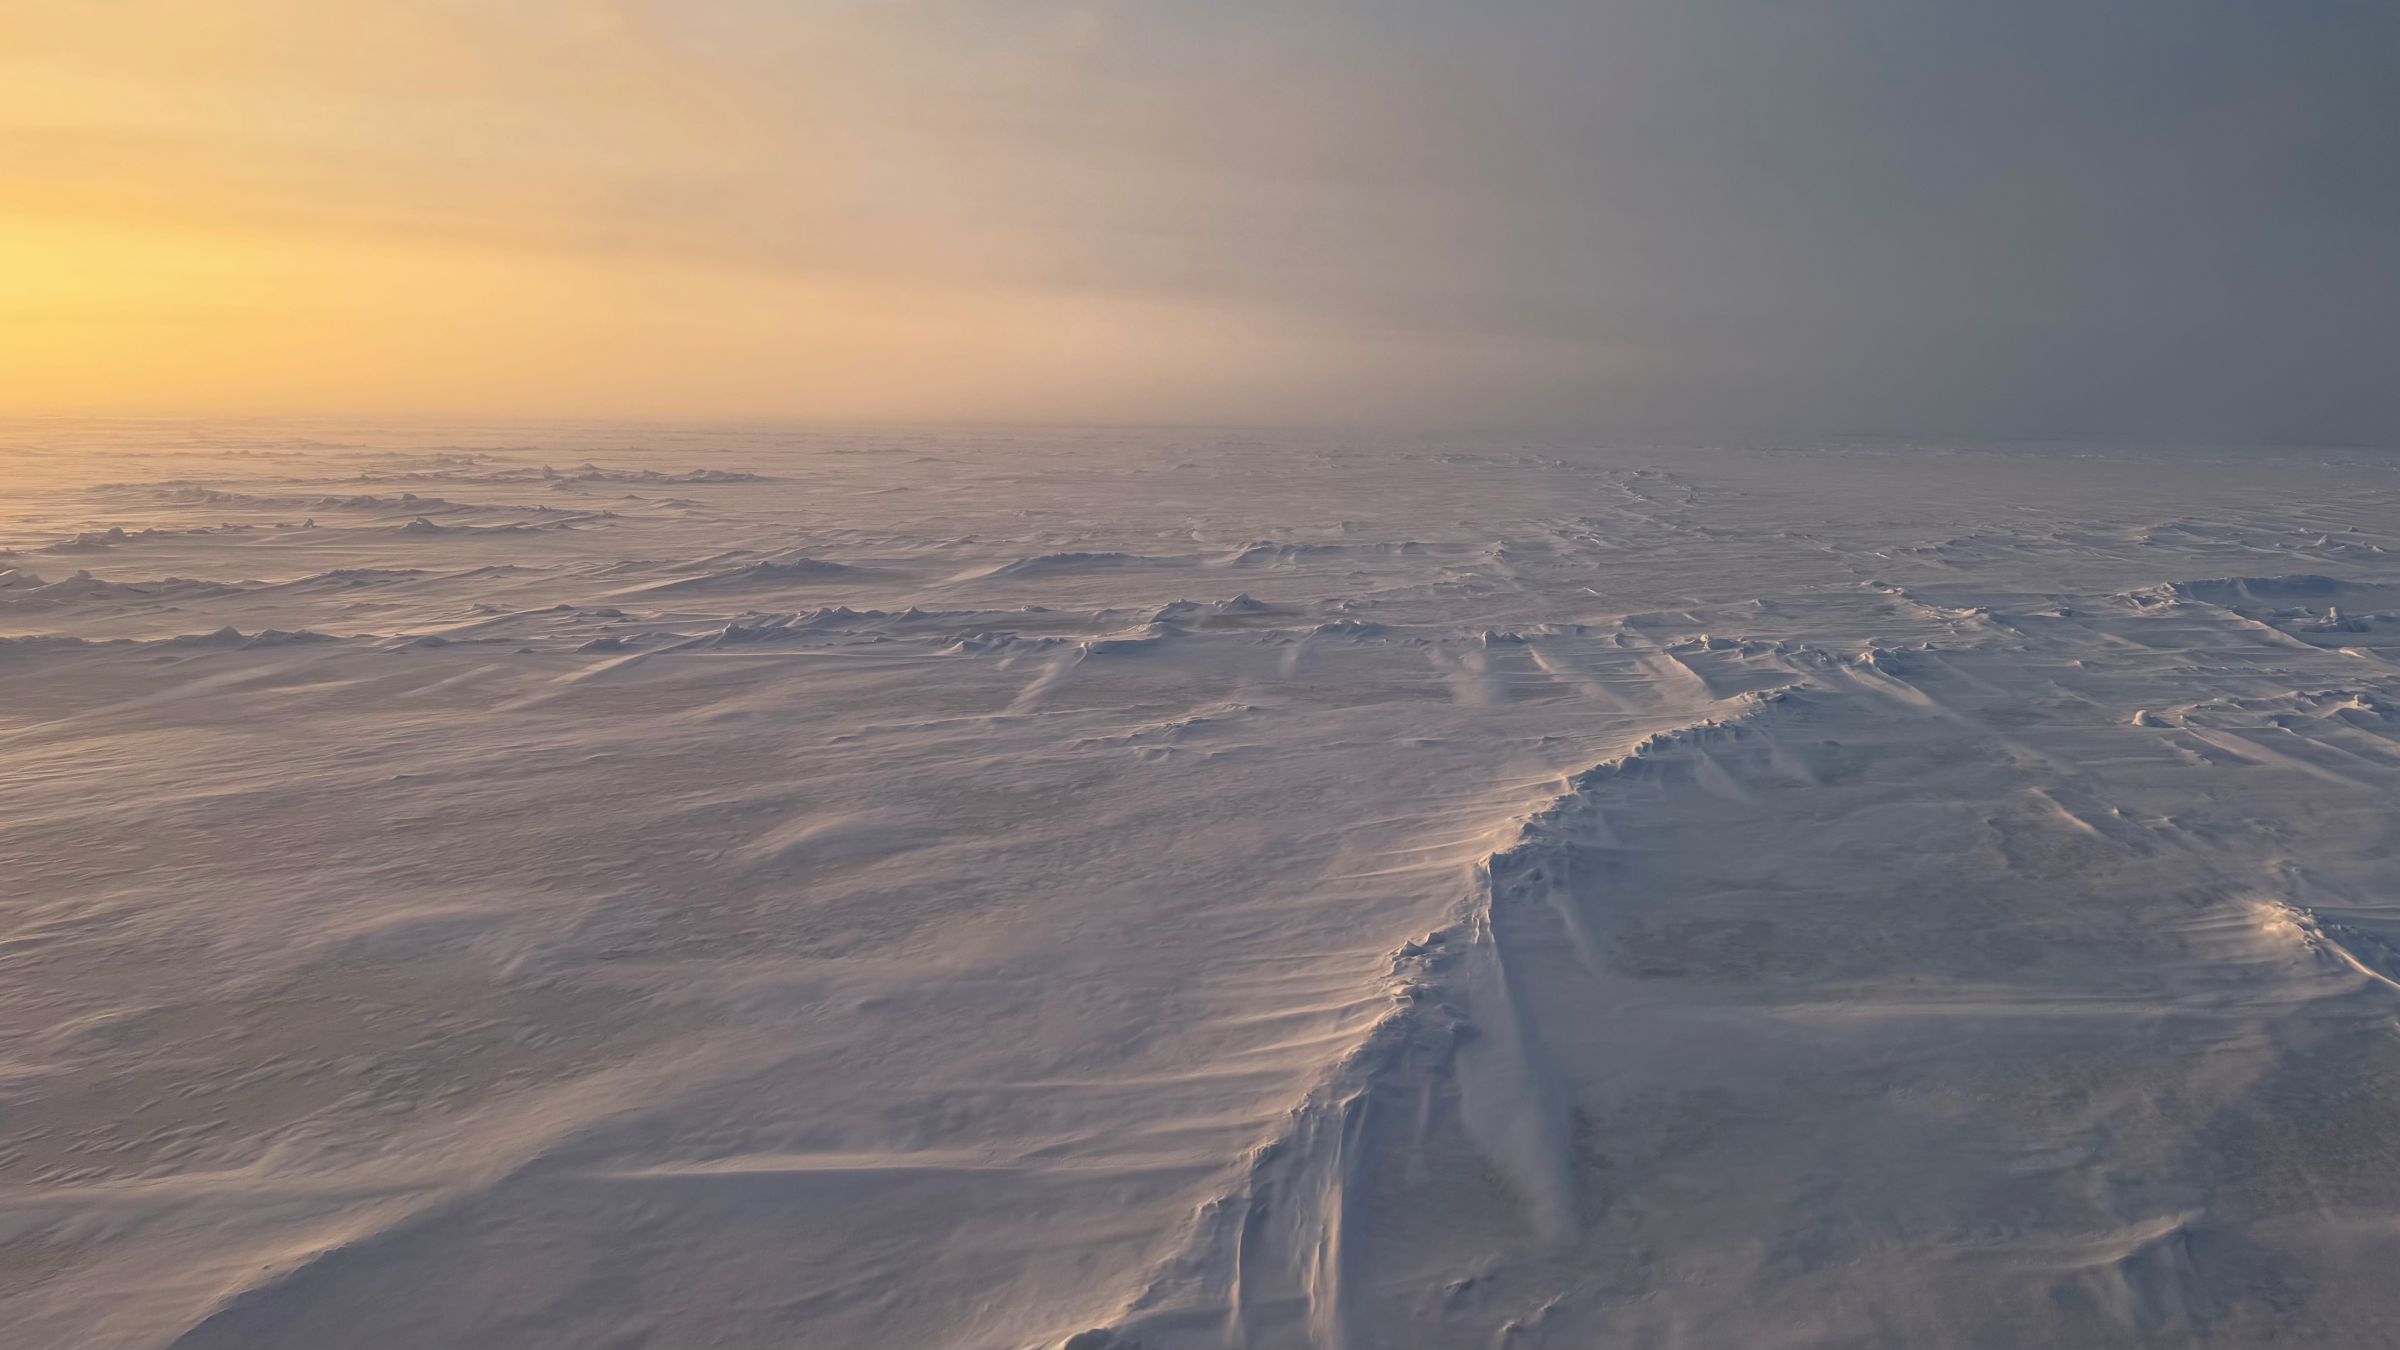
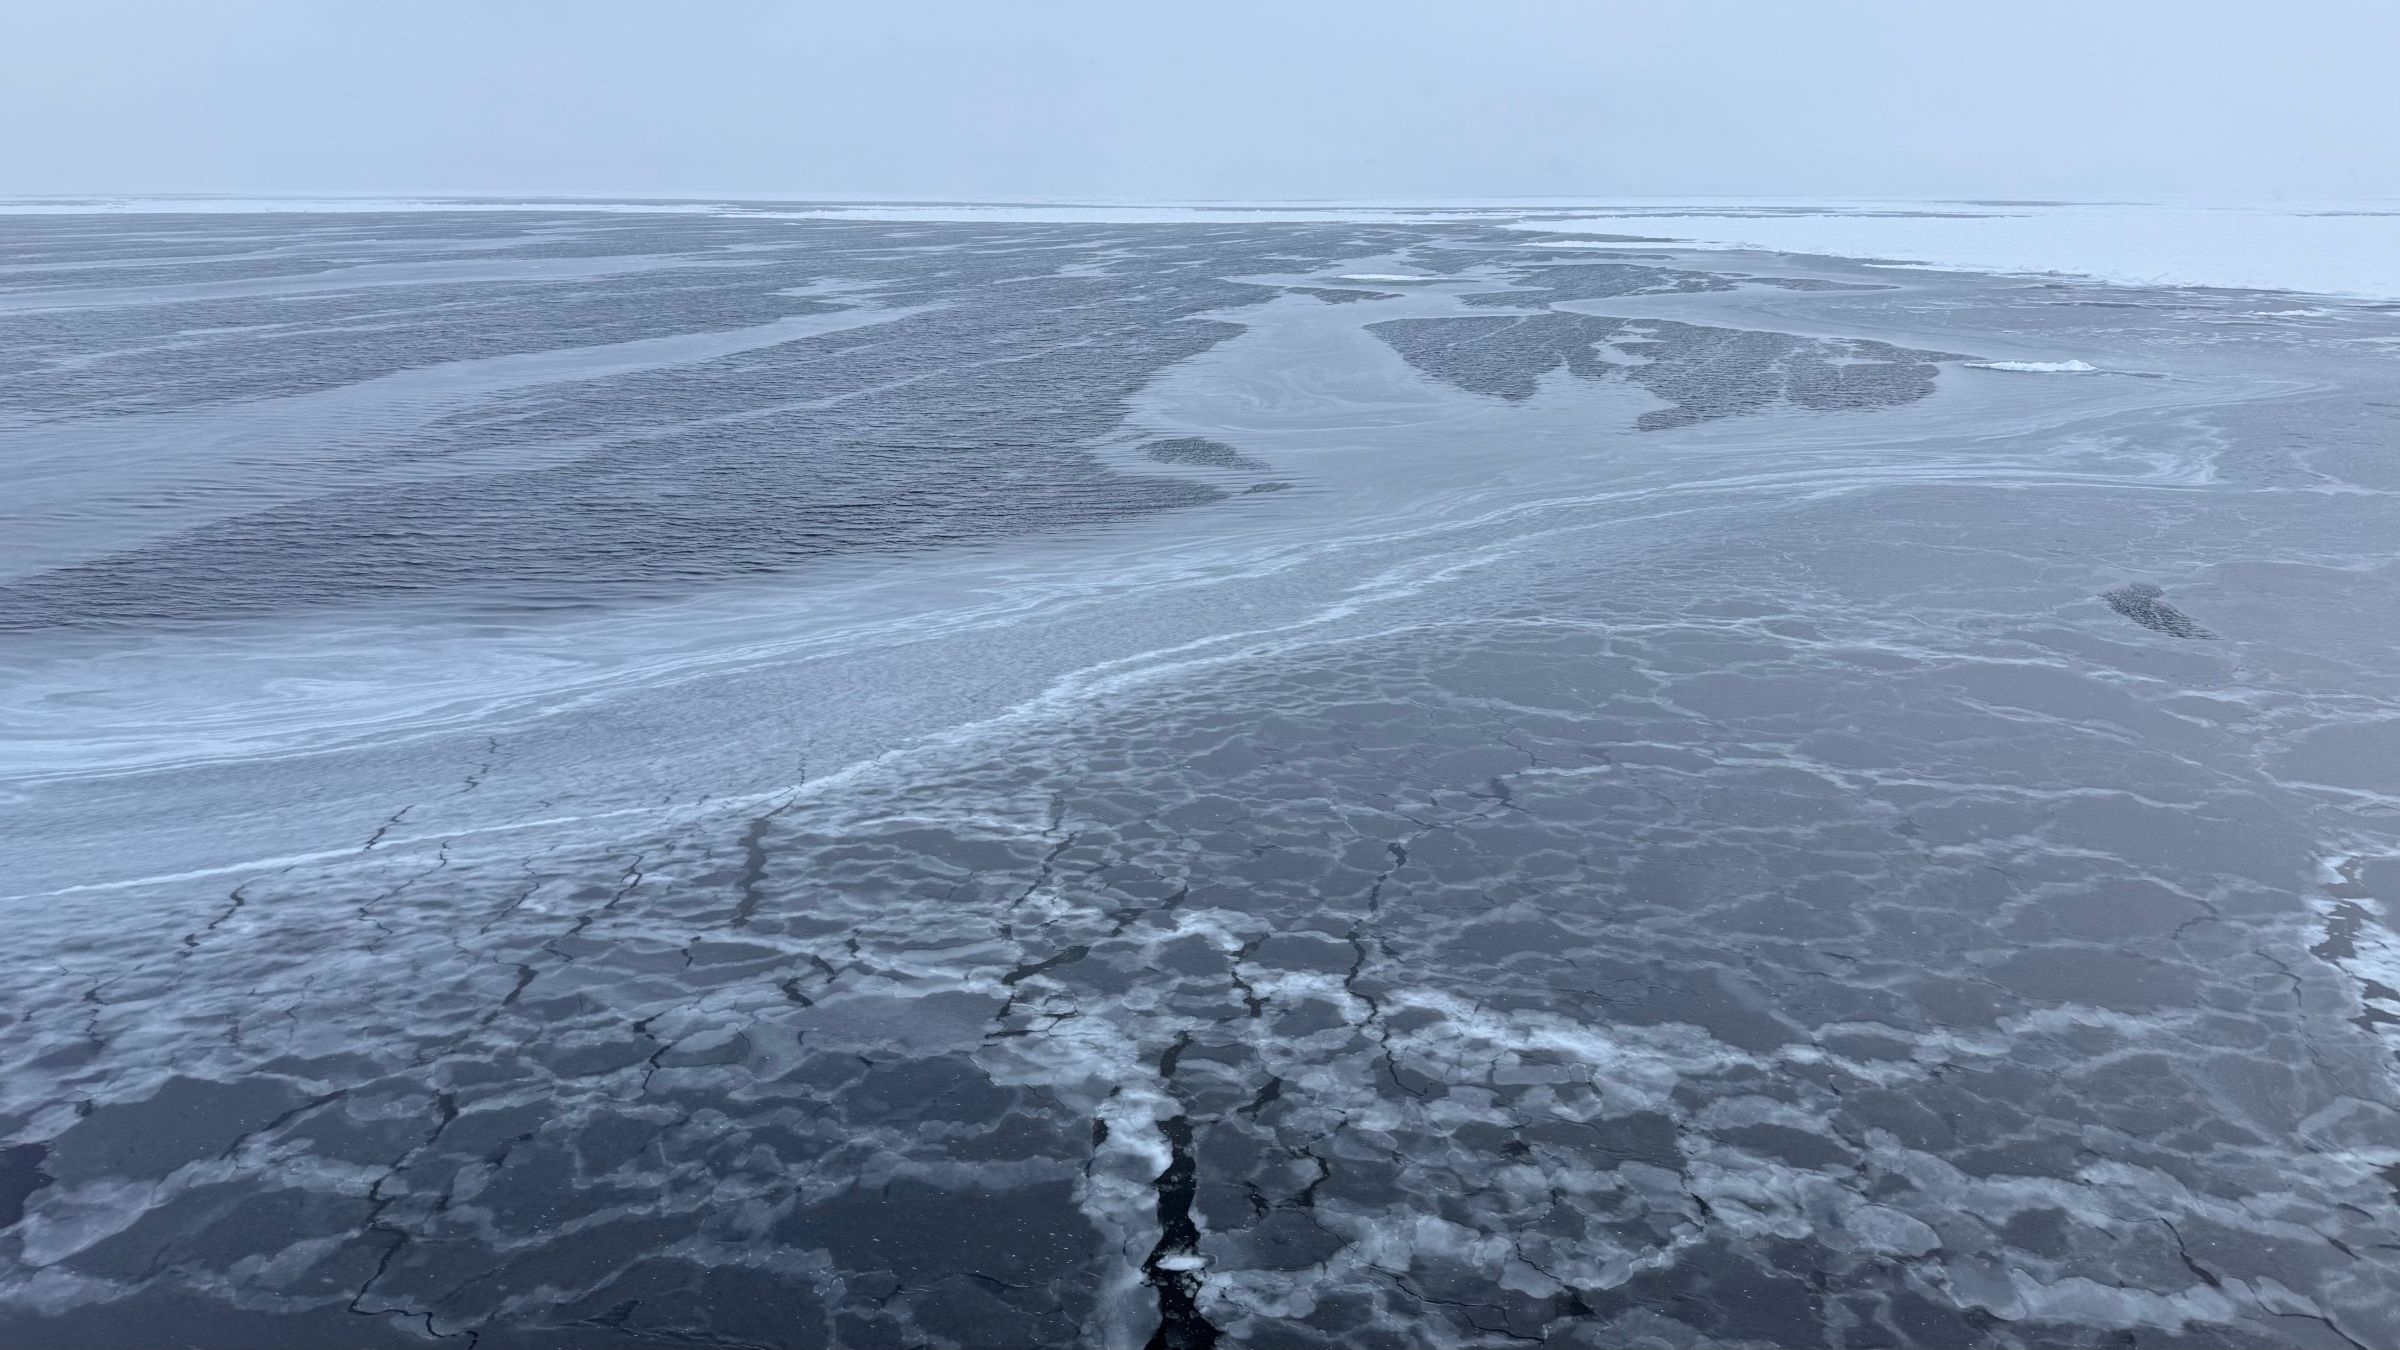
Caption: the surface is where atmosphere, ocean, and sea ice meet, and it has shown itself to us in many different shapes throughout the expedition.
Collaboration
The research onboard is separated into six different work packages (Marine geology; Primary production; Sea ice properties; Physical oceanography; Ocean floor mapping; and Meteorology and Aerosols), but in reality, the borders between the disciplines are not so clear. For example, the winds that we measure are influenced by the friction of the surface, which changes depending on the structures of the sea ice (smooth ice, snow drifts, ridges, …).
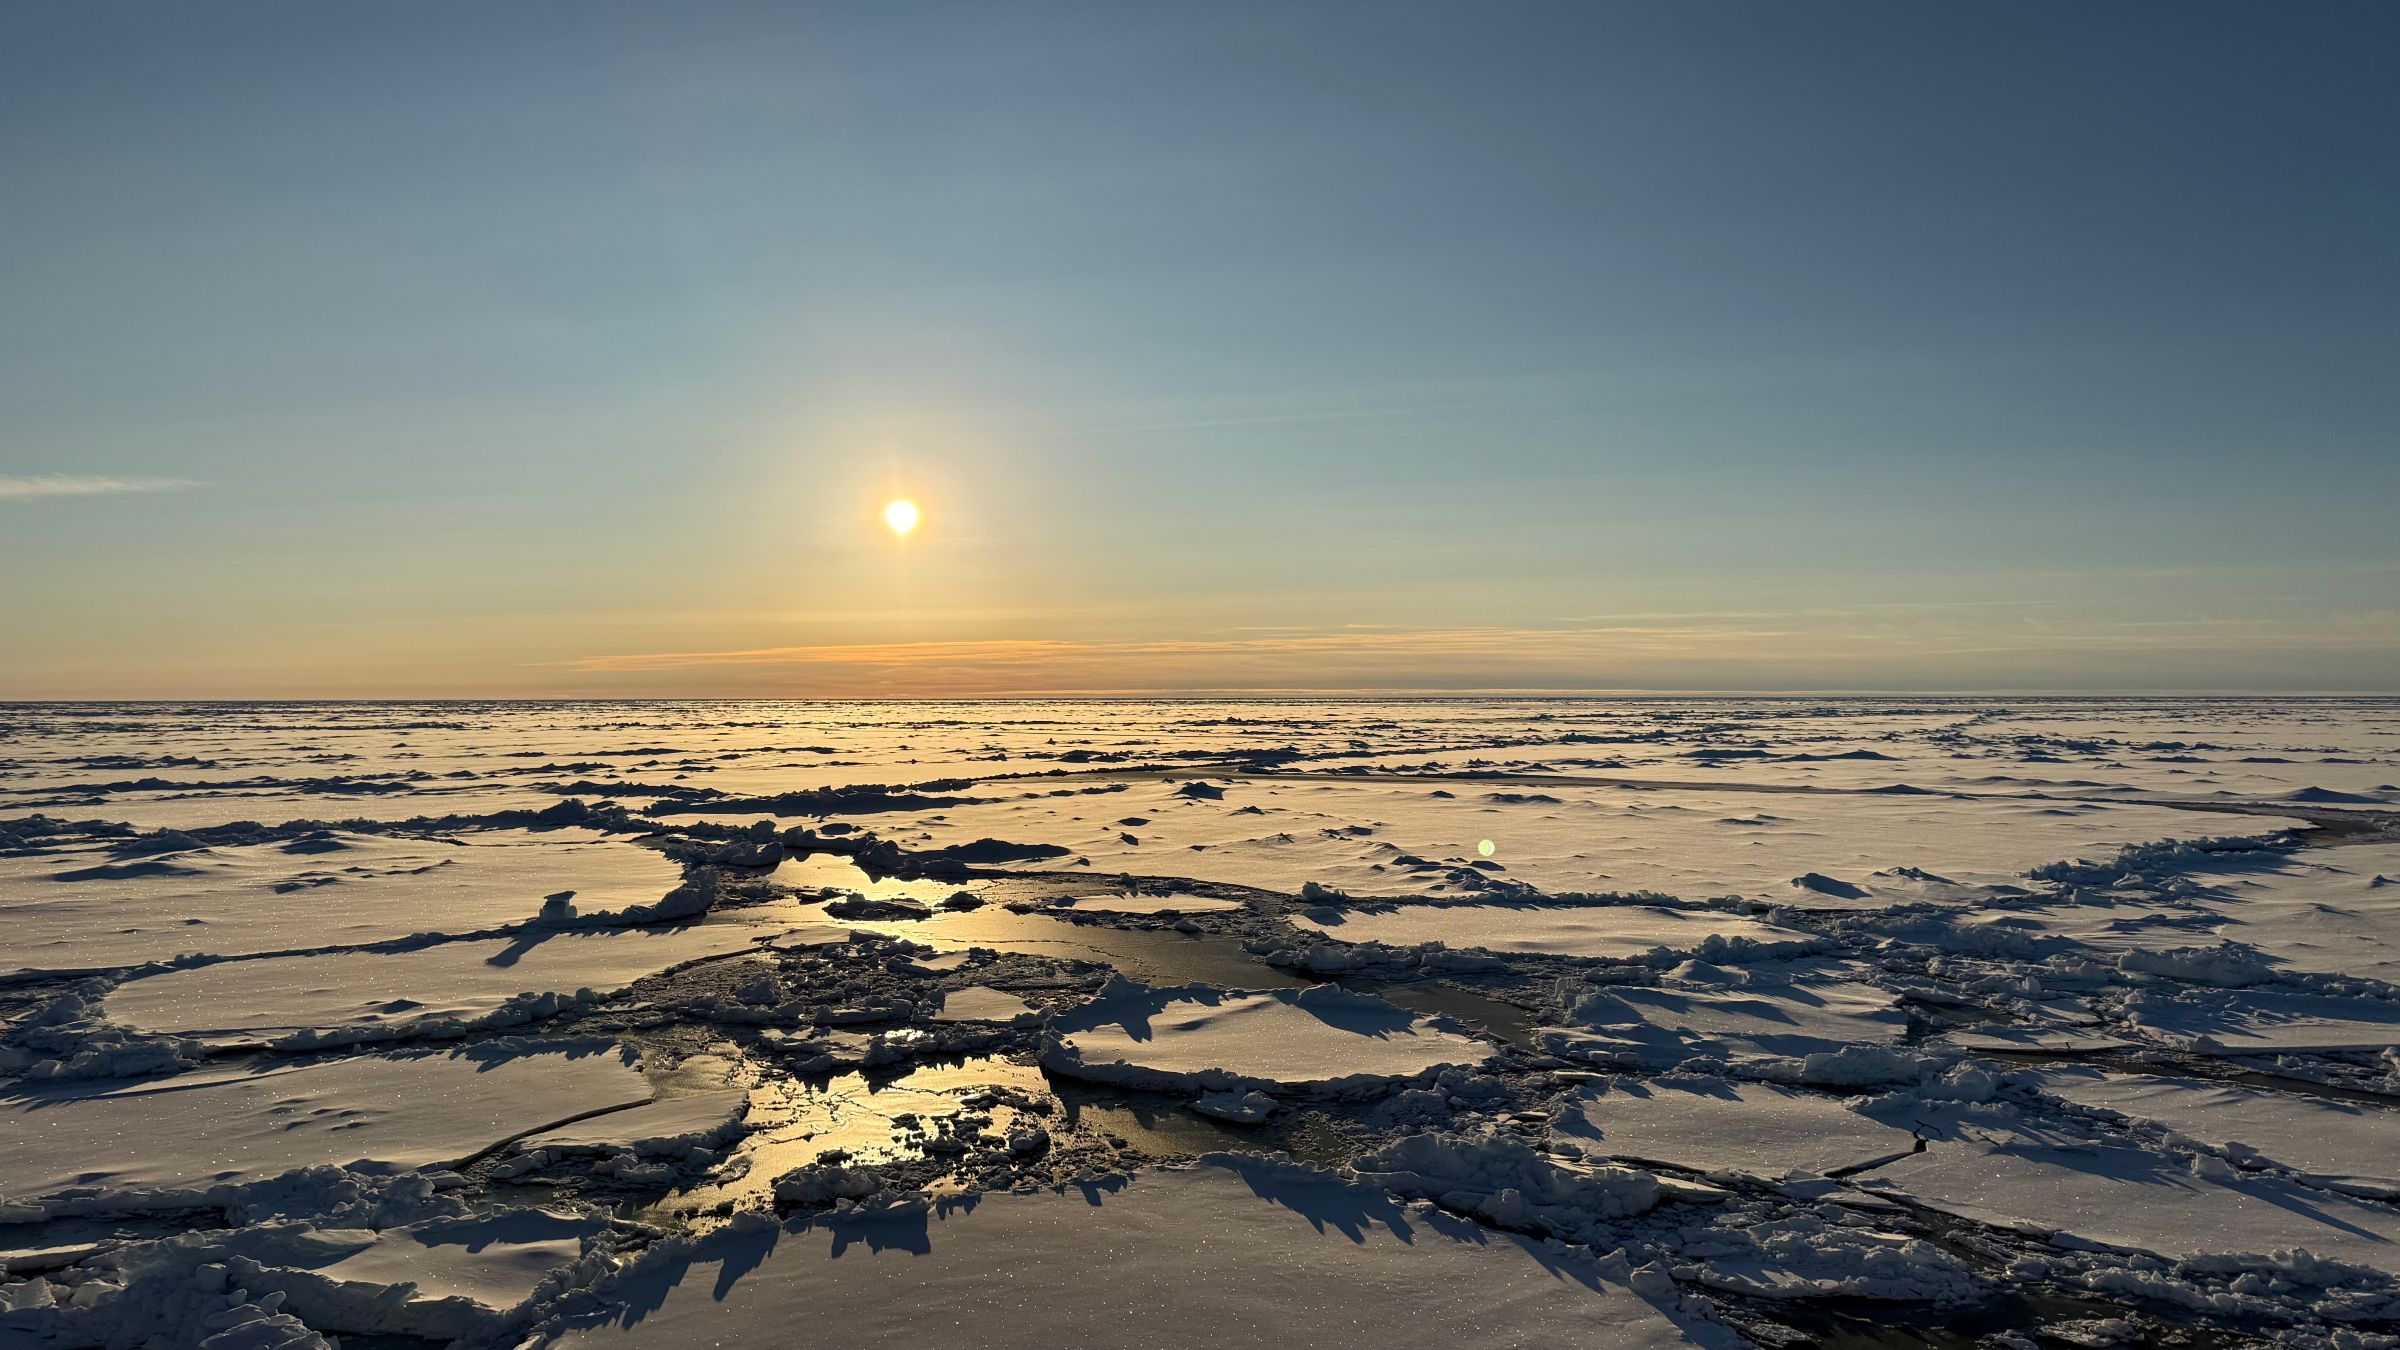
And reversely, the group studying the sea ice is interested in understanding the drift of ice floes, which is influenced by the wind. The wind also drives some of the currents and turbulence in the ocean that the oceanographers are measuring. So we are sharing data between the groups and talking to each other to interpret the data we have collected and to better understand how our respective parts of the system interact.
There are also some collaborations that very directly impact the data collection. The ocean floor mapping team provides information about the seafloor that the geologists use to decide what location is suitable for getting a sediment core.
When there is a CTD (a device that is lowered down through the water, measuring temperature, salinity, and other variables, and filling up bottles with water samples from different depths), the oceanographers measure the concentration of chlorophyll in the water column and based on that information the biologists in the primary production team decide at what depth to focus their water sampling.
There are many reasons for separating science into disciplines, no one can be an expert of everything. But the environment that we are studying does not respect our disciplinary boundaries, and learning to work with others to combine different people’s expertise is key to good research.
/Linnea Huusko (2026-09-15)
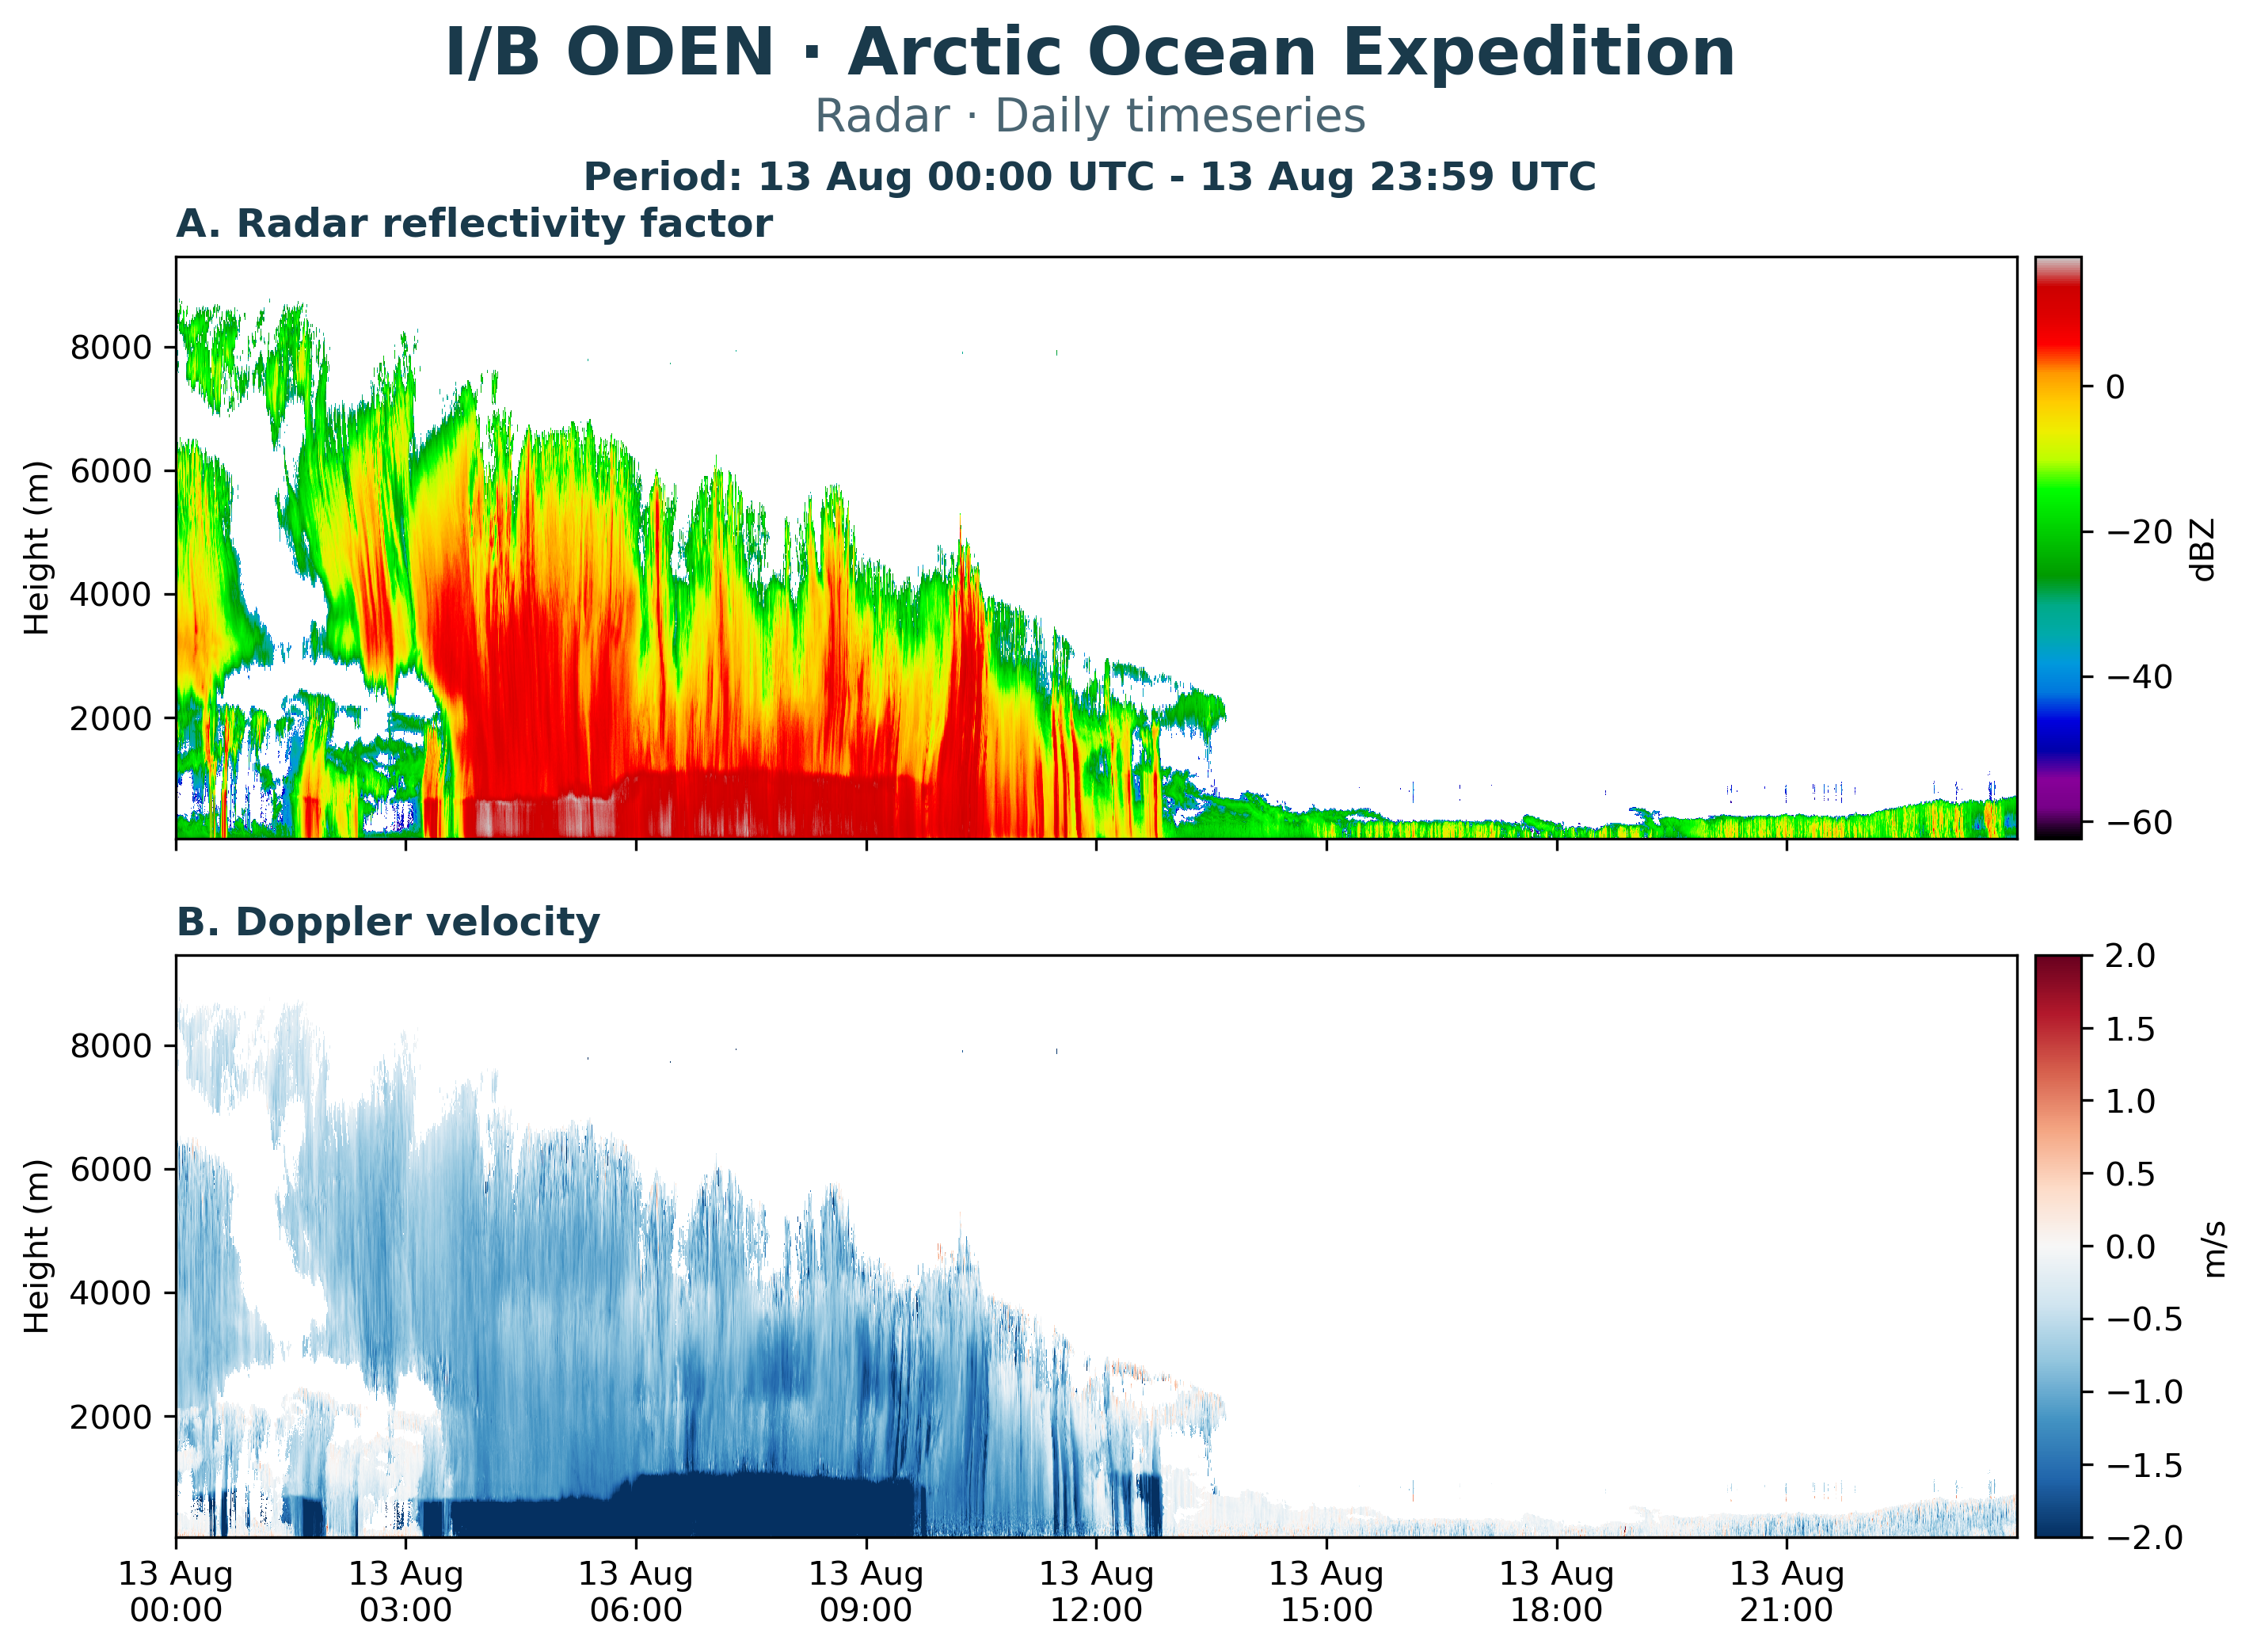
Figure 2: Radar data from a single day, the 13th of August.
Observing the atmosphere
We have 12 different meteorological instruments onboard (plus 6 aerosol instruments), and before the start of the expedition I had experience working with only one of them. So during the five weeks we have spent on Oden so far I have learned a lot about different ways that we can measure the atmosphere.
We have a weather station with instruments that measure different quantities as a timeseries at one point in space. This includes the standard variables that we recognize: air temperature, humidity, wind speed and direction, but also some other things. Figure 1 shows timeseries since the start of the expedition of the variables that we measure with our weather station. We can see how the surface air pressure varies as low- and high pressure systems pass by in panel A. Panel B shows the incoming solar radiation, and even though there is midnight sun we can see in the data that the strength of the radiation from the sun does have a diurnal cycle, with a peak every 24 hours.
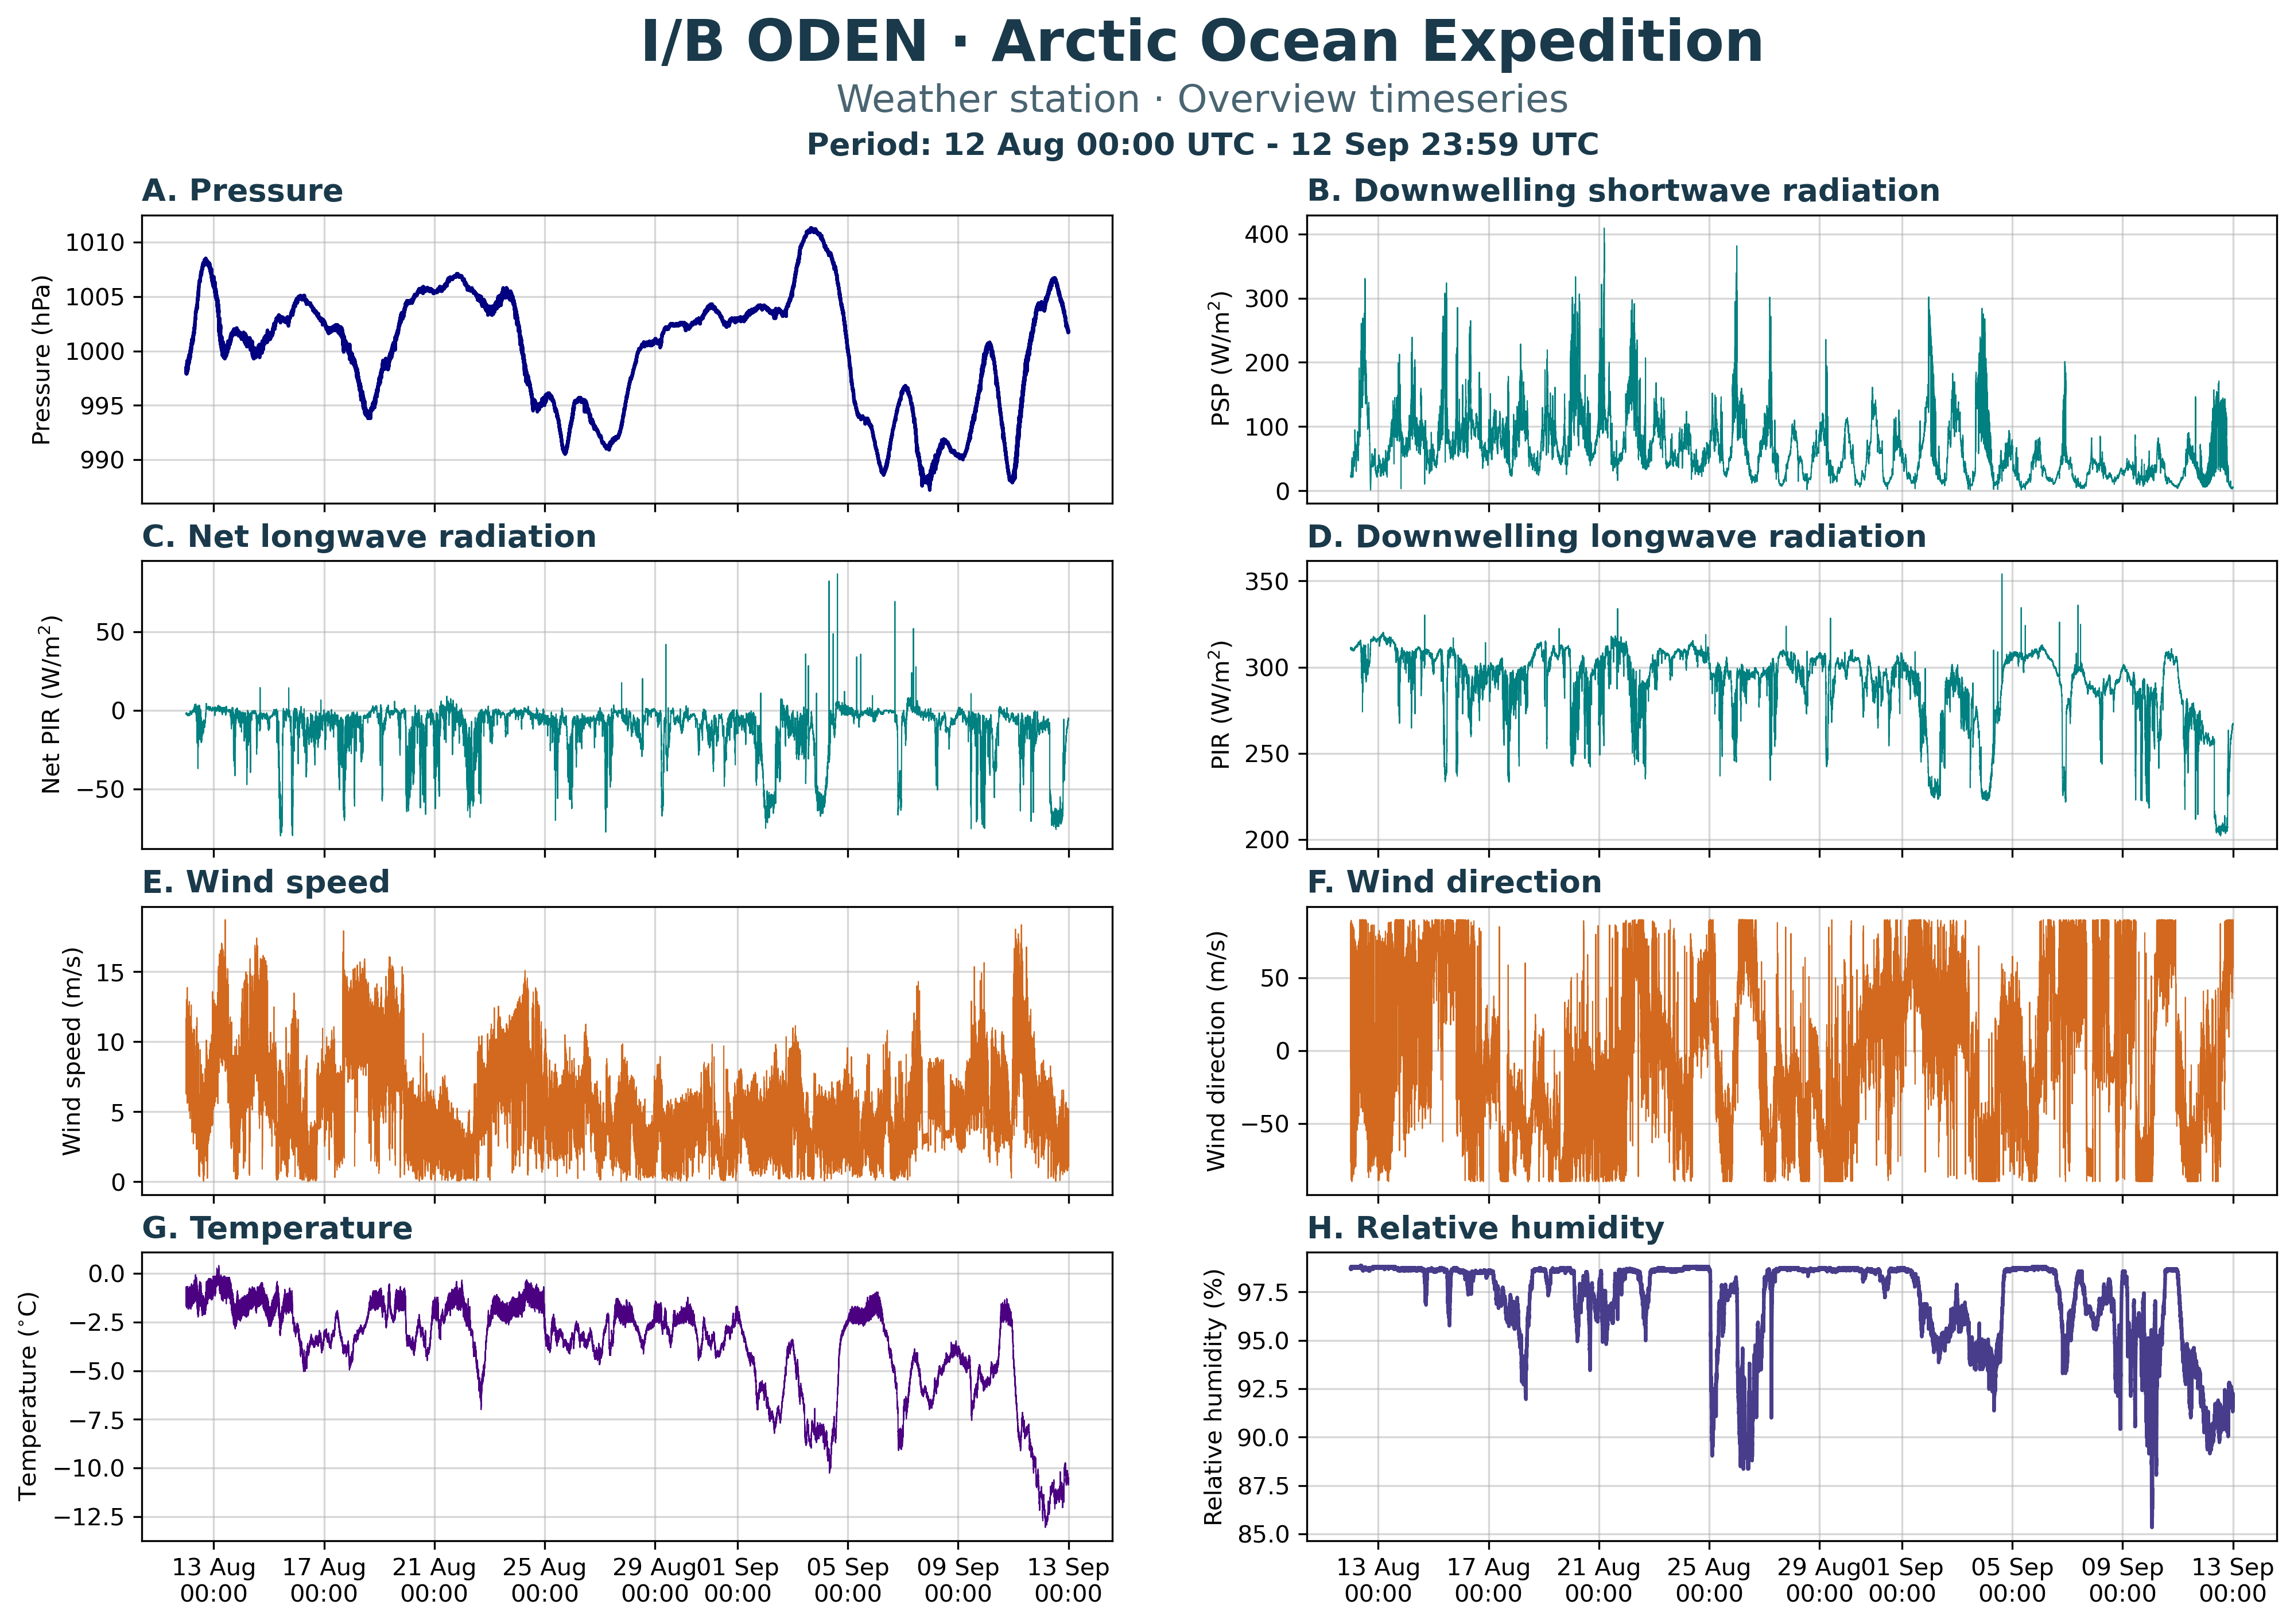
Figure 1: Timeseries of quantities measured by the weather station instruments since the start of the expedition.
Panel G shows that the temperature has been below zero throughout the whole expedition, reaching below -12°C at the coldest. The relative humidity in panel H stays close to 100% a lot of the time, which we notice through the fog that is present most days.
The timeseries in figure 1 give a nice overview of the weather, but to get a more detailed picture of what is happening in the atmosphere we also use more sophisticated instruments. The instrument I think is the coolest is the cloud radar. The radar sends out radio waves that are reflected on particles in the atmosphere, and the instrument measures the reflected signal. Based on this it can calculate the reflectivity of the particles and the vertical velocity with which they are moving.
Figure 2 shows radar data from the 13th of August. Panel A shows the reflectivity, where we can see a deep cloud layer that stretches up over 7000 m above the surface at the start of the day and then becomes shallower as the day goes by. In the afternoon there is only a very shallow layer of fog and low clouds left. Red colors indicate a large reflectivity, corresponding to large particles such as snowflakes. Panel B shows the velocity of the particles, which in this case is negative (meaning downward) almost everywhere. Between 3:00 and 9:30 there is a layer in the lowermost kilometer where the reflectivity is very strong, and the velocity is strongly negative. This is a layer where there is precipitation, whereas above that the cloud particles are just falling very slowly through the cloud.
My research is about numerical simulation and modelling of the atmosphere, but as a modeler it is important to have at least a basic understanding of the possibilities and challenges connected to observations. Ultimately, the models we build are supposed to represent reality, so we need information about reality to verify that our model results are realistic enough.
/Linnea Huusko (2026-09-15)
Last updated: 2026-09-22
Source: MISU