


New report: Nitrogen loads from many Swedish rivers rose in the 2010s
Nitrogen loads from many Swedish rivers to the Baltic Proper and Öresund increased between 2010 and 2020, and the increase is not just an effect of dry years, a new report indicates. The rise coincides with growing use of mineral fertilisers.
After a long period of decline, the nitrogen load carried out by Swedish rivers to the Baltic Proper and Öresund increased during the period 2010–2020, according to the
official HELCOM data. This would represent a major setback after the progress made so far, and a blow to Sweden’s commitments to reduce nutrient loads to the Baltic Sea, as agreed in the Baltic Sea Action Plan.
However, the figures have been questioned because of the method used to normalise for variations in the water flows. The argument is that the method, that is applied to annual totals, does not work well under the very dry conditions that occurred during the period. In a new study, researchers at Stockholm University Baltic Sea Centre, used a different approach to examine this potential increase.
“The HELCOM-PLC assessment of flow-normalised loads and trends, based on the annual data reported by the member countries, is the standard framework to pilot the adoption of measures against eutrophication and assess their effectiveness around the Baltic Sea. When the reliability of the standard assessment is unclear, there are more complex models at our disposal to make the most of the collected monitoring data and build a more robust understanding of the trends,” explains Benoît Dessirier, who is the main author behind the report.
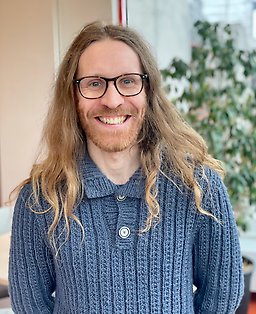
Benoît Dessirier of the Stockholm University Baltic Sea Centre is the lead author of the new report.
By modelling daily concentrations and loads from monthly samples (with the WRTDS method developed at the US Geological Survey), for 89 Swedish catchments, the researchers concluded that the increase was real, at least in this part of Sweden.
“We found an upward trend in many catchments, particularly those dominated by agriculture. In some such areas the nitrogen loads increased by 5, and in some cases even 10 kg of nitrogen per hectare of agricultural land and year, which often brings the loads back to the level around the year 2000,” says Benoît Dessirier.
Increasing use of mineral fertilisers
During the same period the use of mineral nitrogen fertiliser also increased according to official statistics, both at the county level and in the four agricultural regions that concentrate most of the arable production.
“The method we used for this study can’t attribute the causes for the observed trends, but the increased use of fertiliser may well have contributed. One other proposed explanation for this increase in load, that is being discussed in the scientific community, is an increase of mineralisation in soils due to higher temperatures. Both explanations are indirectly supported by the fact that nitrite and nitrate increased more than the total nitrogen, which suggests that the share of organic (and ammonium) nitrogen has decreased,” says Benoît Dessirier.
However, not all catchments dominated by agriculture showed increasing loads.
“There were quite large differences, even within the same region, which indicates that climate was not likely a single main driver, and that some differences in nutrient management were at play. It would be very interesting for future studies to look more closely at what has or has not been done in the catchments where the nitrogen load has increased,” says Bo Gustafsson, director of the modelling group Baltic Nest Institute at the Baltic Sea Centre.
Decline after 2020
The large differences between rivers also highlight that the estimate of the total load can vary greatly depending on which monitored rivers are used to represent the areas that are not monitored.
“On a more positive note, the observed increases in flow-normalised nitrogen loads appear in most studied catchments to have stopped or reversed after 2020 based on the currently available data. Re-assessing these current dynamics with each new year of data and trying to understand the underlying factors will make for interesting work”, concludes Benoît Dessirier.
Text: Lisa Bergqvist
Last updated: 2026-10-29
Source: Stockholm University Baltic Sea Centre